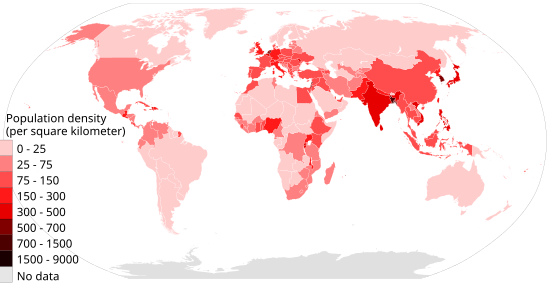
Seznam držav po gostoti prebivalstva
To je seznam držav in odvisnih ozemelj, razvrščenih glede na gostoto prebivalstva, merjeno s številom prebivalcev na kvadratni kilometer. Seznam je mogoče razvrstiti glede na skupno površino in po prebivalstvu. Seznam vključuje suverene države in samoupravna odvisna ozemlja, ki temeljijo na standardu ISO 3166-1. Na seznamu so tudi nepriznane, de facto neodvisne države. Številke v spodnji tabeli temeljijo na površinah, vključno z notranjimi vodnimi telesi, kot so zalivi, jezera in reke. Seznam ne vključuje entitet, ki niso v ISO 3166-1, razen za države z omejeno potrjenostjo. Tako odvisne države, ki niso vključene v ISO 3166-1, in druge entitete, ki niso v ISO 3166-1, kot je Evropska unija, niso vključene. Številke, uporabljene v tem članku, v glavnem temeljijo na zadnjih popisih in uradnih ocenah ali napovedih. Kjer te niso na voljo, se uporabljajo podatki[1] Oddelka za prebivalstvo Združenih narodov za gospodarske in socialne zadeve.[2]

Glavna tabela
urediViri za območja in populacije so iz Združenih narodov, razen če ni drugače navedeno.
| Država / Teritorij | Prebivalstvo | Površina | Gostota | Vir & datum |
|---|---|---|---|---|
| km2 | /km2 | |||
| 686.607 | 33 | 20.806 | 2021 | |
| 36.686 | 2 | 18.343 | 2021 | |
| 5.453.600 | 716 | 7.617 | 2021 | |
| 7.494.578 | 1.104 | 6.789 | 2021 | |
| 32.669 | 6 | 5.445 | 2021 | |
| 1.463.265 | 785 | 1.864 | 2020 | |
| 521.457 | 300 | 1.738 | 2021 | |
| 526.748 | 316 | 1.667 | 2021 | |
| 44.042 | 34 | 1.295 | [3][4] 1. januar 2019 | |
| 64.185 | 53 | 1.211 | 2021 | |
| 169.356.251 | 148.460 | 1.141 | 2021 | |
| 63.065 | 63 | 1.001 | [5] 31. marec 2020 | |
| 109.618 | 116 | 945 | [6] 31. december 2019 | |
| 511 | 49 | 10 | [9] 1. februar 2019 | |
| 5.133.392 | 6.020 | 853 | 2021 | |
| 316.014 | 374 | 845 | 5. september 2017 | |
| 281.200 | 430 | 654 | 2021 | |
| 5.592.631 | 10.452 | 535 | 2021 | |
| 31.948 | 54 | 592 | 1. januar 2017 | |
| 23.859.912 | 36.193 | 659 | [20] 31. januar 2020 | |
| 1.298.915 | 1.969 | 660 | 2021 | |
| 106.537 | 180 | 592 | 2021 | |
| 33.745 | 61 | 553 | 2021 | |
| 51.830.139 | 100.148 | 518 | 2021 | |
| 12.511 | 21 | 596 | 2021 | |
| 13.461.888 | 26.338 | 511 | 2021 | |
| 17.501.696 | 37.354 | 469 | 2021 | |
| 11.204 | 26 | 431 | 2021 | |
| 8.900.059 | 22.072 | 403 | 2022 | |
| 1.407.563.842 | 3.287.263 | 428 | 2021 | |
| 12.551.213 | 27.834 | 451 | 2021 | |
| 11.447.569 | 27.750 | 413 | 2021 | |
| 10.861 | 25 | 434 | 1. januar 2017 | |
| 11.611.419 | 30.528 | 380 | 2021 | |
| 821.625 | 2.235 | 368 | 2021 | |
| 190.338 | 444 | 429 | 2021 | |
| 113.880.328 | 300.000 | 380 | 2021 | |
| 966.129 | 2.513 | 384 | 2021 | |
| 3.256.028 | 8.870 | 367 | 2021 | |
| 179.651 | 539 | 333 | 2021 | |
| 124.612.530 | 377.930 | 330 | 2021 | |
| 368.796 | 1.128 | 327 | 2021 | |
| 124.610 | 344 | 362 | 2021 | |
| 21.773.441 | 65.610 | 332 | 2021 | |
| 42.050 | 181 | 232 | 2021 | |
| 6.314.167 | 21.041 | 300 | 2021 | |
| 170.534 | 549 | 311 | 2021 | |
| 100.091 | 347 | 288 | 2021 | |
| 97.468.029 | 330.957 | 295 | 2021 | |
| 104.332 | 389 | 268 | 2021 | |
| 45.035 | 199 | 226 | 2021 | |
| 67.281.039 | 242.495 | 277 | 2021 | |
| 1.525.663 | 5.130 | 297 | 2021 | |
| 2.827.695 | 10.991 | 257 | 2021 | |
| 68.136 | 264 | 258 | 2021 | |
| 231.402.117 | 881.913 | 262 | 2021 | |
| 2.688.235 | 11.607 | 232 | 2021 | |
| 39.039 | 160 | 244 | 2021 | |
| 396.051 | 1.705 | 232 | 2021 | |
| 639.321 | 2.586 | 247 | 2021 | |
| 83.408.554 | 357.137 | 234 | 2021 | |
| 4.250.114 | 17.818 | 239 | 2021 | |
| 11.117.873 | 48.192 | 231 | 2021 | |
| 223.107 | 964 | 231 | 2021 | |
| 93.219 | 442 | 211 | 2021 | |
| 106.471 | 456 | 233 | 2021 | |
| 213.401.323 | 923.768 | 231 | 2021 | |
| 25.971.909 | 120.538 | 215 | 2021 | |
| 8.691.406 | 41.285 | 211 | 2021 | |
| 2.639.916 | 11.295 | 234 | 2021 | |
| 59.240.329 | 301.339 | 197 | 2021 | |
| 47.606 | 261 | 182 | 2021 | |
| 31.122 | 151 | 206 | 2021 | |
| 30.034.989 | 147.181 | 204 | 2021 | |
| 45.853.778 | 241.550 | 190 | 2021 | |
| 1.935.259 | 10.887 | 178 | 31. december 2018 | |
| 79.034 | 468 | 169 | 2021 | |
| 15.753 | 91 | 173 | 2021 | |
| 534.606 | 702 | 762 | 2021 | |
| 128.874 | 726 | 178 | 2021 | |
| 17.608.483 | 108.889 | 162 | 2021 | |
| 19.889.742 | 118.484 | 168 | 2021 | |
| 3.138 | 21 | 149 | 1. julij 2015 [navedi vir] | |
| 1.933 | 13 | 149 | 1. januar 2016 [navedi vir] | |
| 1.425.893.465 | 9.596.961 | 149 | 2021 | |
| 84.263 | 572 | 147 | 2021 | |
| 273.753.191 | 1.910.931 | 143 | 2021 | |
| 8.644.829 | 56.785 | 152 | 2021 | |
| 106.017 | 747 | 142 | 2021 | |
| 10.510.751 | 78.866 | 133 | 2021 | |
| 71.601.103 | 513.120 | 140 | 2021 | |
| 587.925 | 4.033 | 146 | 2021 | |
| 5.854.240 | 43.094 | 136 | 2021 | |
| 1.244.188 | 9.251 | 134 | 2021 | |
| 32.833.031 | 238.533 | 138 | 2021 | |
| 49.481 | 457 | 108 | 2021 | |
| 38.307.726 | 311.888 | 123 | 2021 | |
| 3.061.506 | 33.846 | 90 | 2021 | |
| 64.531.444 | 551.500 | 117 | 2021 | |
| 10.312.992 | 86.600 | 119 | 2021 | |
| 9.365.145 | 83.600 | 112 | 2021 | |
| 11.148.278 | 89.328 | 125 | 2021 | |
| 10.290.103 | 92.212 | 112 | 2021 | |
| 5.447.622 | 49.036 | 111 | 2021 | |
| 1.849 | 12 | 154 | 2021 | |
| 8.922.082 | 83.871 | 106 | 2021 | |
| 8.420.641 | 72.300 | 116 | 2021 | |
| 84.775.404 | 783.562 | 108 | 2021 | |
| 9.709.786 | 93.026 | 104 | 2021 | |
| 11.256.372 | 109.884 | 102 | 2021 | |
| 2.119.410 | 20.273 | 105 | 2021 | |
| 2.854.710 | 28.748 | 99 | 2021 | |
| 12.996.895 | 114.763 | 113 | 2021 | |
| 7.296.769 | 88.361 | 83 | 2021 | |
| 2.790.974 | 29.743 | 94 | 2021 | |
| 120.283.026 | 1.104.300 | 109 | 2021 | |
| 109.262.178 | 1.002.000 | 109 | 2021 | |
| 5.153.957 | 51.100 | 101 | 2021 | |
| 72.412 | 751 | 96 | 2021 | |
| 33.573.874 | 330.803 | 101 | 2021 | |
| 47.486.935 | 505.992 | 94 | 2021 | |
| 21.324.367 | 185.180 | 115 | 2021 | |
| 16.589.023 | 181.035 | 92 | 2021 | |
| 43.533.592 | 435.244 | 100 | 2021 | |
| 53.005.614 | 591.958 | 90 | 2021 | |
| 10.278.345 | 112.492 | 91 | 2021 | |
| 1.320.942 | 14.919 | 89 | 2021 | |
| 11.627 | 142 | 82 | 2021 | |
| 19.328.560 | 238.391 | 81 | 2021 | |
| 2.103.330 | 25.713 | 82 | 2021 | |
| 37.076.584 | 446.550 | 83 | 2021 | |
| 16.876.720 | 196.712 | 86 | 2021 | |
| 10.445.365 | 131.957 | 79 | 2021 | |
| 53.798.084 | 676.578 | 80 | 2021 | |
| 27.478.249 | 322.463 | 85 | 2021 | |
| 445.373 | 5.765 | 77 | 2021 | |
| 17.003 | 236 | 72 | 2021 | |
| 347.251 | 4.163 | 83 | [22] 2021 estimate | |
| 4.060.135 | 56.594 | 72 | 2021 | |
| 43.531.422 | 603.500 | 72 | 2021 | |
| 34.081.449 | 447.400 | 76 | 2021 | |
| 22.100.683 | 272.967 | 81 | 2021 | |
| 12.262.946 | 163.610 | 75 | 2021 | |
| 304.032 | 4.000 | 76 | 2021 | |
| 2.281.454 | 30.355 | 75 | 2021 | |
| 4.986.526 | 69.825 | 71 | 2021 | |
| 218.764 | 2.842 | 77 | 2021 | |
| 17.797.737 | 256.369 | 69 | 2021 | |
| 1.192.271 | 17.363 | 69 | 2021 | |
| 3.270.943 | 51.209 | 64 | 2021 | |
| 20.104 | 294 | 68 | 31. december 2014 [navedi vir] | |
| 126.705.138 | 1.964.375 | 65 | 2021 | |
| 6.885.868 | 110.912 | 62 | 2021 | |
| 9.750.064 | 143.100 | 68 | 2021 | |
| 63.588.334 | 947.303 | 67 | 2021 | |
| Svet (brez Antarktike) | 8.130.516.000 | 134.740.000 | 60 | [23]21. jul. 2024 |
| 3.688.647 | 69.700 | 53 | 2021 | |
| 40.099.462 | 652.864 | 61 | 2021 | |
| 4.351.267 | 75.417 | 58 | 2021 | |
| 32.981.641 | 527.968 | 62 | 2021 | |
| Svet (kopno) | 8.130.516.000 | 148.940.000 | 55 | [23]21. jul. 2024 |
| 27.198.628 | 475.650 | 57 | 2021 | |
| 2.060.721 | 36.125 | 57 | 2021 | |
| 13.531.906 | 245.857 | 55 | 2021 | |
| 87.923.432 | 1.628.750 | 54 | 2021 | |
| 6.850.540 | 130.373 | 53 | 2021 | |
| 2.188 | 36 | 61 | [24] 9. avgust 2016 | |
| 4.417 | 103 | 43 | 2021 | |
| 926.276 | 18.272 | 51 | 2021 | |
| 120.000 | 3.170 | 38 | 14 Oct 2015 [navedi vir] | |
| 59.392.255 | 1.221.037 | 49 | 2021 | |
| 1.634.466 | 28.051 | 58 | 2021 | |
| 9.578.167 | 207.600 | 46 | 2021 | |
| 627.859 | 13.812 | 45 | 2021 | |
| 28.915.653 | 587.295 | 49 | 2021 | |
| 51.516.562 | 1.141.748 | 45 | 2021 | |
| 5.193.416 | 111.369 | 47 | 2021 | |
| 2.786.651 | 65.300 | 43 | 2021 | |
| 1.105.557 | 23.200 | 48 | 2021 | |
| 45.114 | 948 | 48 | 2021 | |
| 544 | 14 | 39 | 9. avgust 2016 | |
| 18.024 | 459 | 39 | 2021 | |
| 15.993.524 | 390.757 | 41 | 2021 | |
| 32.077.072 | 801.590 | 40 | 2021 | |
| 95.894.118 | 2.344.858 | 41 | 2021 | |
| 52.889 | 1.393 | 38 | 2021 | |
| 336.997.624 | 9.629.091 | 35 | 2021 | |
| 6.527.743 | 199.949 | 33 | 2021 | |
| 28.199.867 | 912.050 | 31 | 2021 | |
| 7.425.057 | 236.800 | 31 | 2021 | |
| 1.873.919 | 64.562 | 29 | 2021 | |
| 3.620.312 | 117.600 | 31 | 2021 | |
| 1.328.701 | 45.227 | 29 | 2021 | |
| 407.906 | 13.943 | 29 | 2021 | |
| 34.503.774 | 1.246.700 | 28 | 2021 | |
| 214.326.223 | 8.514.877 | 25 | 2021 | |
| 19.493.184 | 756.102 | 26 | 2021 | |
| 33.715.471 | 1.285.216 | 26 | 2021 | |
| 5.883 | 242 | 24 | 2021 | |
| 319.137 | 12.189 | 26 | 2021 | |
| 17.065.581 | 637.657 | 27 | 2021 | |
| 19.473.125 | 752.612 | 26 | 2021 | |
| 707.851 | 28.896 | 24 | 2021 | |
| 45.657.202 | 1.861.484 | 25 | [26] 1. julij 2017 | |
| 10.467.097 | 450.295 | 23 | 2021 | |
| 4.171.898 | 176.120 | 24 | 17. avgust 2017 [navedi vir] | |
| 777.486 | 38.394 | 20 | 2021 | |
| 10.748.272 | 644.329 | 17 | [27] 1. julij 2019 | |
| 3.426.260 | 176.215 | 19 | 2021 | |
| 30.129 | 1.580 | 19 | [28] 31. december 2018 | |
| 9.949.437 | 462.840 | 21 | 2021 | |
| 44.177.969 | 2.381.741 | 19 | 2021 | |
| 25.252.722 | 1.267.000 | 20 | 2021 | |
| 5.129.727 | 270.467 | 19 | 2021 | |
| 6.703.799 | 406.752 | 16 | 2021 | |
| 400.031 | 22.966 | 17 | 2021 | |
| 5.403.021 | 323.787 | 17 | 2021 | |
| 5.535.992 | 336.852 | 16 | 2021 | |
| 45.276.780 | 2.780.400 | 16 | 2021 | |
| 35.950.396 | 2.149.690 | 17 | 2021 | |
| 4.520.471 | 309.500 | 15 | 2021 | |
| 1.843 | 135 | 14 | 9 Aug 2011 | |
| 5.835.806 | 342.000 | 17 | 2021 | |
| 21.904.983 | 1.240.192 | 18 | 2021 | |
| 271.407 | 18.575 | 15 | 2021 | |
| 5.404 | 394 | 14 | 7. februar 2016 | |
| 16.244.513 | 1.284.000 | 13 | 2021 | |
| 6.341.855 | 488.100 | 13 | 2021 | |
| 47 | 5 | 9 | [31] 20. september 2016 | |
| 12.079.472 | 1.098.581 | 11 | 2021 | |
| 145.102.755 | 17.098.246 | 8 | 2021 | |
| 2.341.179 | 267.668 | 9 | 2021 | |
| 5.457.154 | 622.984 | 9 | 2021 | |
| 19.196.465 | 2.724.900 | 7 | 2021 | |
| 1.937 | 260 | 7 | 2021 | |
| 38.155.012 | 9.093.507 | 4 | 2021 | |
| 4.614.974 | 1.030.700 | 4 | 2021 | |
| 2.588.423 | 582.000 | 4 | 2021 | |
| 6.735.277 | 1.759.540 | 4 | 2021 | |
| 804.567 | 214.969 | 4 | 2021 | |
| 612.985 | 163.820 | 4 | 2021 | |
| 297.449 | 83.534 | 4 | 2021 | |
| 25.921.089 | 7.692.024 | 3 | 2021 | |
| 370.335 | 103.000 | 4 | 2021 | |
| 2.530.151 | 824.268 | 3 | 2021 | |
| 565.581 | 266.000 | 2 | 2021 | |
| 3.347.782 | 1.564.116 | 2 | 2021 | |
| 3.764 | 12.173 | 0 | 2021 | |
| 2.939 | 62.422 | 0 | [32] 1. september 2012 | |
| 56.243 | 2.166.086 | 0 | 2021 |
Opomba: Podatki niso na voljo za Akrotiri in Dhekelijo, Donecko ljudsko republiko, Lugansko ljudsko republiko in Severni Ciper.
Opombe
uredi- ↑ Joledar De Agostini Atlas (italijansko) je v svoji izdaji iz leta 1930 navedel velikost območja Vatikana kot 0,44 km2[7], vendar ga je v izdaji 1945–46 popravil na 0,49 km2.[8] Podatek 0,44 km2 številni viri še vedno navajajo kljub temu, da je le ta netočen.
Leta 2019 je bilo skupno število prebivalcev 825, od tega 453 prebivalcev in 372 nerezidentov. Za izračun gostote prebivalstva se upoštevajo se le rezidenti. - ↑ Znana tudi kot Republika Kitajska. Tako Republika Kitajska kot Ljudska republika Kitajska uradno trdita, da predstavljata celotno Kitajsko, pri čemer navajata, da je Kitajska de jure ena sama suverena entiteta, ki obsega tako območje, ki ga nadzoruje LRK, kot območje, ki ga nadzoruje RK. Niti LRK niti RK uradno ne priznavata zahtevka druga druge po državnosti in tekmujeta za diplomatsko priznanje kot edina legitimna predstavnika Kitajske med drugimi državami.
- ↑ Država v svobodni zvezi z Združenimi državami.
- ↑ Kosovo je predmet ozemeljskega spora med Republiko Srbijo in Republiko Kosovo. Po neuspešnih pogajanjih o ustavnem statusu Kosova pod pokroviteljstvom Združenih narodov je 17. februarja 2008 prehodna kosovska vlada enostransko razglasila neodvisnost od Srbije, vendar Srbija še vedno šteje Kosovo kot lastno avtonomno pokrajino. Kosovo mednarodno priznava 97 od 193 članic Združenih narodov.
- ↑ Država v svobodni zvezi z Združenimi državami.
- ↑ Država v svobodni zvezi z Novo Zelandijo.
- ↑ Ne priznava jo nobena država članica ZN.
- ↑ Brez Krima.
- ↑ Ne priznava ga nobena država članica ZN.
- ↑ Država v svobodni zvezi z Združenimi državami.
- ↑ Ne priznava jo nobena država članica ZN.
- ↑ Vključno s prebivalstvom in območjem Avtonomne republike Krim in mesta Sevastopol, upravnih območij Ukrajine na polotoku Krim, ki si jih lasti Rusija.
- ↑ Država v svobodni zvezi z Novo Zelandijo.
- ↑ Sporno ozemlje. Uprava je razdeljena med Marokom in Demokratično arabsko republiko Sahara, ki si obe lastita celotno ozemlje. Upravni nadzor Demokratičnae arabske republike Sahara je omejen na približno 20% ozemlja, preostalih 80% ozemlja pa zaseda Maroko.
Sklici
uredi- ↑ »World Population Prospects - Population Division - United Nations«. 17. oktober 2015. Arhivirano iz prvotnega spletišča dne 17. oktobra 2015. Pridobljeno 21. julija 2021.
- ↑ »World Population Prospects«. Arhivirano iz prvotnega spletišča dne 19. septembra 2016. Pridobljeno 26. oktobra 2016.
- ↑ Latest developments Arhivirano September 30, 2016, na Wayback Machine.
- ↑ 4,0 4,1 4,2 4,3 4,4 4,5 4,6 »Country Comparisons: Area«. The World Factbook. www.cia.gov (poročilo). Central Intelligence Agency. Pridobljeno 10. junija 2021.
- ↑ PO Box 23, St Peter Port (31. januar 2018). »Electronic Census; Latest Population, Employment and Earnings«. www.gov.gg (v angleščini). Pridobljeno 21. julija 2021.
- ↑ »Error« (PDF).
- ↑ Calendario atlante De Agostini (v italijanščini). Istituto geografico De Agostini.
- ↑ Calendario atlante De Agostini (v italijanščini). Istituto geografico De Agostini.
- ↑ »Popolazione«. www.vaticanstate.va. Pridobljeno 21. julija 2021.
- ↑ »256 500 habitants à Mayotte en 2017 - Insee Analyses Mayotte - 15«. www.insee.fr. Pridobljeno 21. julija 2021.
- ↑ »List of the total areas of the world's countries, dependencies, and territories«. Encyclopedia Britannica (v angleščini). Pridobljeno 9. junija 2021.
- ↑ »Asia«. Encyclopædia Britannica. 16. november 2020. Pridobljeno 20. julija 2021.
- ↑ »Africa«. Encyclopædia Britannica. 30. oktober 2020. Pridobljeno 20. julija 2021.
- ↑ »North America«. Encyclopædia Britannica. 12. februar 2021. Pridobljeno 20. julija 2021.
- ↑ »South America«. Encyclopædia Britannica. 7. februar 2021. Pridobljeno 20. julija 2021.
- ↑ »Antarctica«. Encyclopædia Britannica. 10. marec 2021. Pridobljeno 20. julija 2021.
- ↑ »Europe«. Encyclopædia Britannica. 26. november 2020. Pridobljeno 20. julija 2021.
- ↑ »Oceania«. Encyclopædia Britannica. 30. januar 2020. Pridobljeno 20. julija 2021.
- ↑ 19,0 19,1 https://www.insee.fr/fr/statistiques/fichier/4265429/ensemble.pdf
- ↑ »National Statistics. Republic of China (Taiwan)«. eng.stat.gov.tw. Pridobljeno 21. julija 2021.
- ↑ »Population Estimates, 2017 |«. ask.rks-gov.net. Arhivirano iz prvotnega spletišča dne 24. aprila 2020. Pridobljeno 21. julija 2021.
- ↑ Gherasim, Cristian (2. avgust 2021). »Moldova facing Europe's worst demographic crisis«. EUobserver.
- ↑ 23,0 23,1 »Population Clock«. www.census.gov. Pridobljeno 21. julija 2021.
- ↑ »2016 Census QuickStats: Cocos (Keeling) Islands«. quickstats.censusdata.abs.gov.au (v angleščini). Arhivirano iz prvotnega spletišča dne 1. februarja 2021. Pridobljeno 21. julija 2021.
- ↑ »2016 Census QuickStats: Cocos (Keeling) Islands«. quickstats.censusdata.abs.gov.au (v angleščini). Arhivirano iz prvotnega spletišča dne 1. februarja 2021. Pridobljeno 21. julija 2021.
- ↑ »Sub-national Population Projections of Sudan and Age-Sex Composition«. 20. oktober 2017. Arhivirano iz prvotnega spletišča dne 20. oktobra 2017. Pridobljeno 21. julija 2021.[mrtva povezava]
- ↑ »Home | the Republic of South Sudan« (PDF). 12. april 2019. Arhivirano iz prvotnega spletišča (PDF) dne 12. aprila 2019. Pridobljeno 21. julija 2021.
- ↑ »Välkommen till ÅSUB! | Ålands statistik- och utredningsbyrå«. www.asub.ax. Pridobljeno 21. julija 2021.
- ↑ »Australia: Agglomerations - Population Statistics. Maps. Charts. Weather and Web Information«. www.citypopulation.de. Pridobljeno 21. julija 2021.
- ↑ http://www.sainthelena.gov.sh/wp-content/uploads/2016/06/Census-2016-summary-report.pdf
- ↑ »Pitcairn: Islands & Settlement - Population Statistics, Maps, Charts, Weather and Web Information«. www.citypopulation.de. Pridobljeno 21. julija 2021.
- ↑ »Svalbard: Archipelagos, Settlements and Stations - Population Statistics, Maps, Charts, Weather and Web Information«. www.citypopulation.de. Pridobljeno 21. julija 2021.